Coaster Fusion
Algorithm Validation Report
The Coaster Fusion algorithm is a collection of AI and sensor fusion models powering the Coaster Logger app. It takes consumer-grade accelerometer, gyroscope, barometer, GPS, microphone and heart rate data from smartphones and smartwatches, and produces an accurate 3D digital twin model of each ride experience. From this digital representation, the complete roller coaster track and other key metrics, such as the real height, speed, g-forces are derived. It also estimates roller coaster specific metrics, such as inversions, drops and airtimes. The Coaster Fusion algorithm is proprietary, but its validation is shared here so you can understand what you can expect when you use Coaster Logger to track your rides.

Before we go further into the algorithm, do first checkout the Coaster Logger app which is powered by the Coaster Fusion algorithm!
Dataset
The output of the Coaster Fusion algorithm has been validated on a total of 3453 individual ride sessions from 2016 to 2025, collected on 513 distinct roller coasters from parks around the world. These ride sessions cover different phone / watch platforms (iPhone, Android, Apple Watch), different seat locations, and different times of day, in order to be representative of a full breadth of realistic riding scenarios.
It is important to note that we never bring phones on rides where it is forbidden to do so, or is not consented by the ride operators under special circumstances. In all cases, the phone is secured in a zipped pocket and never taken out during the ride. For the majority of the dataset, phones are either placed in the front-pocket or back-pocket. In some situations, they are placed in coat pockets or inside shoes. Additionally, some recordings were collected using Apple Watches.
Phone models used for data collection includes: iPhone12, iPhone 15, SM-G991B, iPhone 15 Plus, Pixel 8, iPhone 11 Pro, iPhone 13 Pro, iPhone 14 Pro, Mi Note 10 Lite, iPhone16, SM-G973F, SM-G920F, iPhone 15 Pro, iPhone XS Max, iPhone 17 Pro, iPhone SE, Samsung Galaxy S25, Apple Watch Series 10, Apple Watch Series 9 and Apple Watch Series 8. Part of the dataset was collected using the Sensor Logger app, before the Coaster Logger app was ready. Measurements were taken at the maximum available sampling rate in the early years, but reduced to 50Hz in recent years, as that was deemed sufficient.
Coaster Fusion may use different underlying model combinations, depending on the hardware and available measurements. As such, it is useful to also separate the dataset into subsets:
Complete Dataset: This includes all tracks, all hardware and all conditions
Watch Only Dataset: This includes only tracks made using Apple Watch (No Android Wear for now, but I am looking to collect some data soon)
GPS-Denied Dataset: This includes tracks with no GPS measurements, either because the ride is indoors or the GPS values never update throughout the ride, regardless of hardware — though this is more common on watches than smartphones.
Validation Metrics
The output of Coaster Fusion is validated against 6 different metrics:
Maximum Acceleration RMSE
Maximum Speed RMSE
Total Track Length RMSE
Maximum Height RMSE
Inversion Count RMSE
Horizontal Shape Matching Score
For metrics like maximum acceleration ("g-force"), maximum speed, total track length, maximum height, and inversion count, we calculate the Root Mean Square Error (RMSE) against reference values sourced from databases such as the Roller Coaster Database (RCDB) and Coasterpedia — labelled as “Literature Value” in subsequent plots.

Example manually tracked horizontal trajectory using satellite imagery (not shown) at Carowinds.
To assess the accuracy of the generated coaster's shape compared to the actual track geometry, we introduce a custom Horizontal Shape Matching Score. This process begins by manually outlining the real coaster’s track geometry using satellite imagery using Google Maps. The outlines are then converted into Euclidean meter measurements, starting from the coaster's initial point. Both the traced target shape and the estimated horizontal trajectories are resampled into equally spaced meter intervals.
Since the lengths of the target and estimated geometries may differ, we apply dynamic warping to align segments, up to a specified distance threshold. Additionally, we allow for matching from both the start and the end of the track to account for data trimming issues. The RMSE, calculated in meters across these segments, is then averaged and divided by the diagonal length of the traced coaster's bounding box, producing a dimensionless Horizontal Shape Matching Score. This normalisation is makes it easier to compare values across different rides of different sizes.
For outdoor rides, where the track is completely or mostly visible from satellite imagery, the manual tracing is easy. The primary sources of error for these traced tracks are occluded indoor sections and perspectives of the satellite view, particularly for very tall roller coasters. Where possible, the tracing is augmented by referencing roller coaster blueprints published on the internet. Indoor rides are largely excluded from the shape matching score calculations. This means that the validation score is biased towards outdoor conditions, and may not be representative of fully indoor rides.
For all six metrics, we primarily strive to minimise the mean of the distribution. But we also try to minimise the standard deviation, indicative of variability of performance, and the maximum, indicative of the worst-case performance.
Results
The latest version of the algorithm produces results that generally align well with literature values. The results presented in this section are based solely on iPhone data; corresponding results for Android devices and the Apple Watch are provided in the Appendix. The analysis is separated by device type because different hardware follows slightly different code paths and uses slightly different hyperparameters.

Comparison for height, speed, force and length RMSE between estimated values and literature value. The first bracketed value is the RMSE, and N is the population. N varies across these plots because literature values may not be available for every ride in the validation dataset. The diagonal dotted line is the 1:1 line (not the line of best fit).
Maximum height estimation has a RMSE of 4.54m, with a standard deviation of 2.07m. In the best case scenario, one can expect much less than a meter difference between the estimated maximum height and the literature value. The worst case scenario can possibly be attributed to the difference in definition of height — The Coaster Fusion algorithm defines height as the difference between the lowest and highest point of the track, regardless of where the ground level is. However, this may not be the case for literature values.
Maximum speed estimation also demonstrates good agreement, with a RMSE of 2.61 m/s. The standard deviation is 1.77m/s, with the maximum deviation being 16.2m/s. In terms of acceleration, the RMSE is 0.89g, with a standard deviation of 0.47g, both of which are well within the expected variation in forces within normal operating conditions.
The length RMSE is comparatively speaking the worst performing metric, with a RMSE of 135m, meaning on average, the coaster length can be up to a hundred meter away from the literature value. This is a common issue dead-reckoning style algorithm faces due to sensor noise related drift. There is further error due to incorrect truncation, both over and under, of the ride. Generally, recordings that start and end promptly before and after the ride fair better. Indeed, the length RMSE varies wildly across tracks. In the best case scenario, Coaster Fusion estimated the total track length to within a meter. However, in the worst case scenario, the noted difference is more than a kilometer — in these cases, you should just disregard the recording and try again!

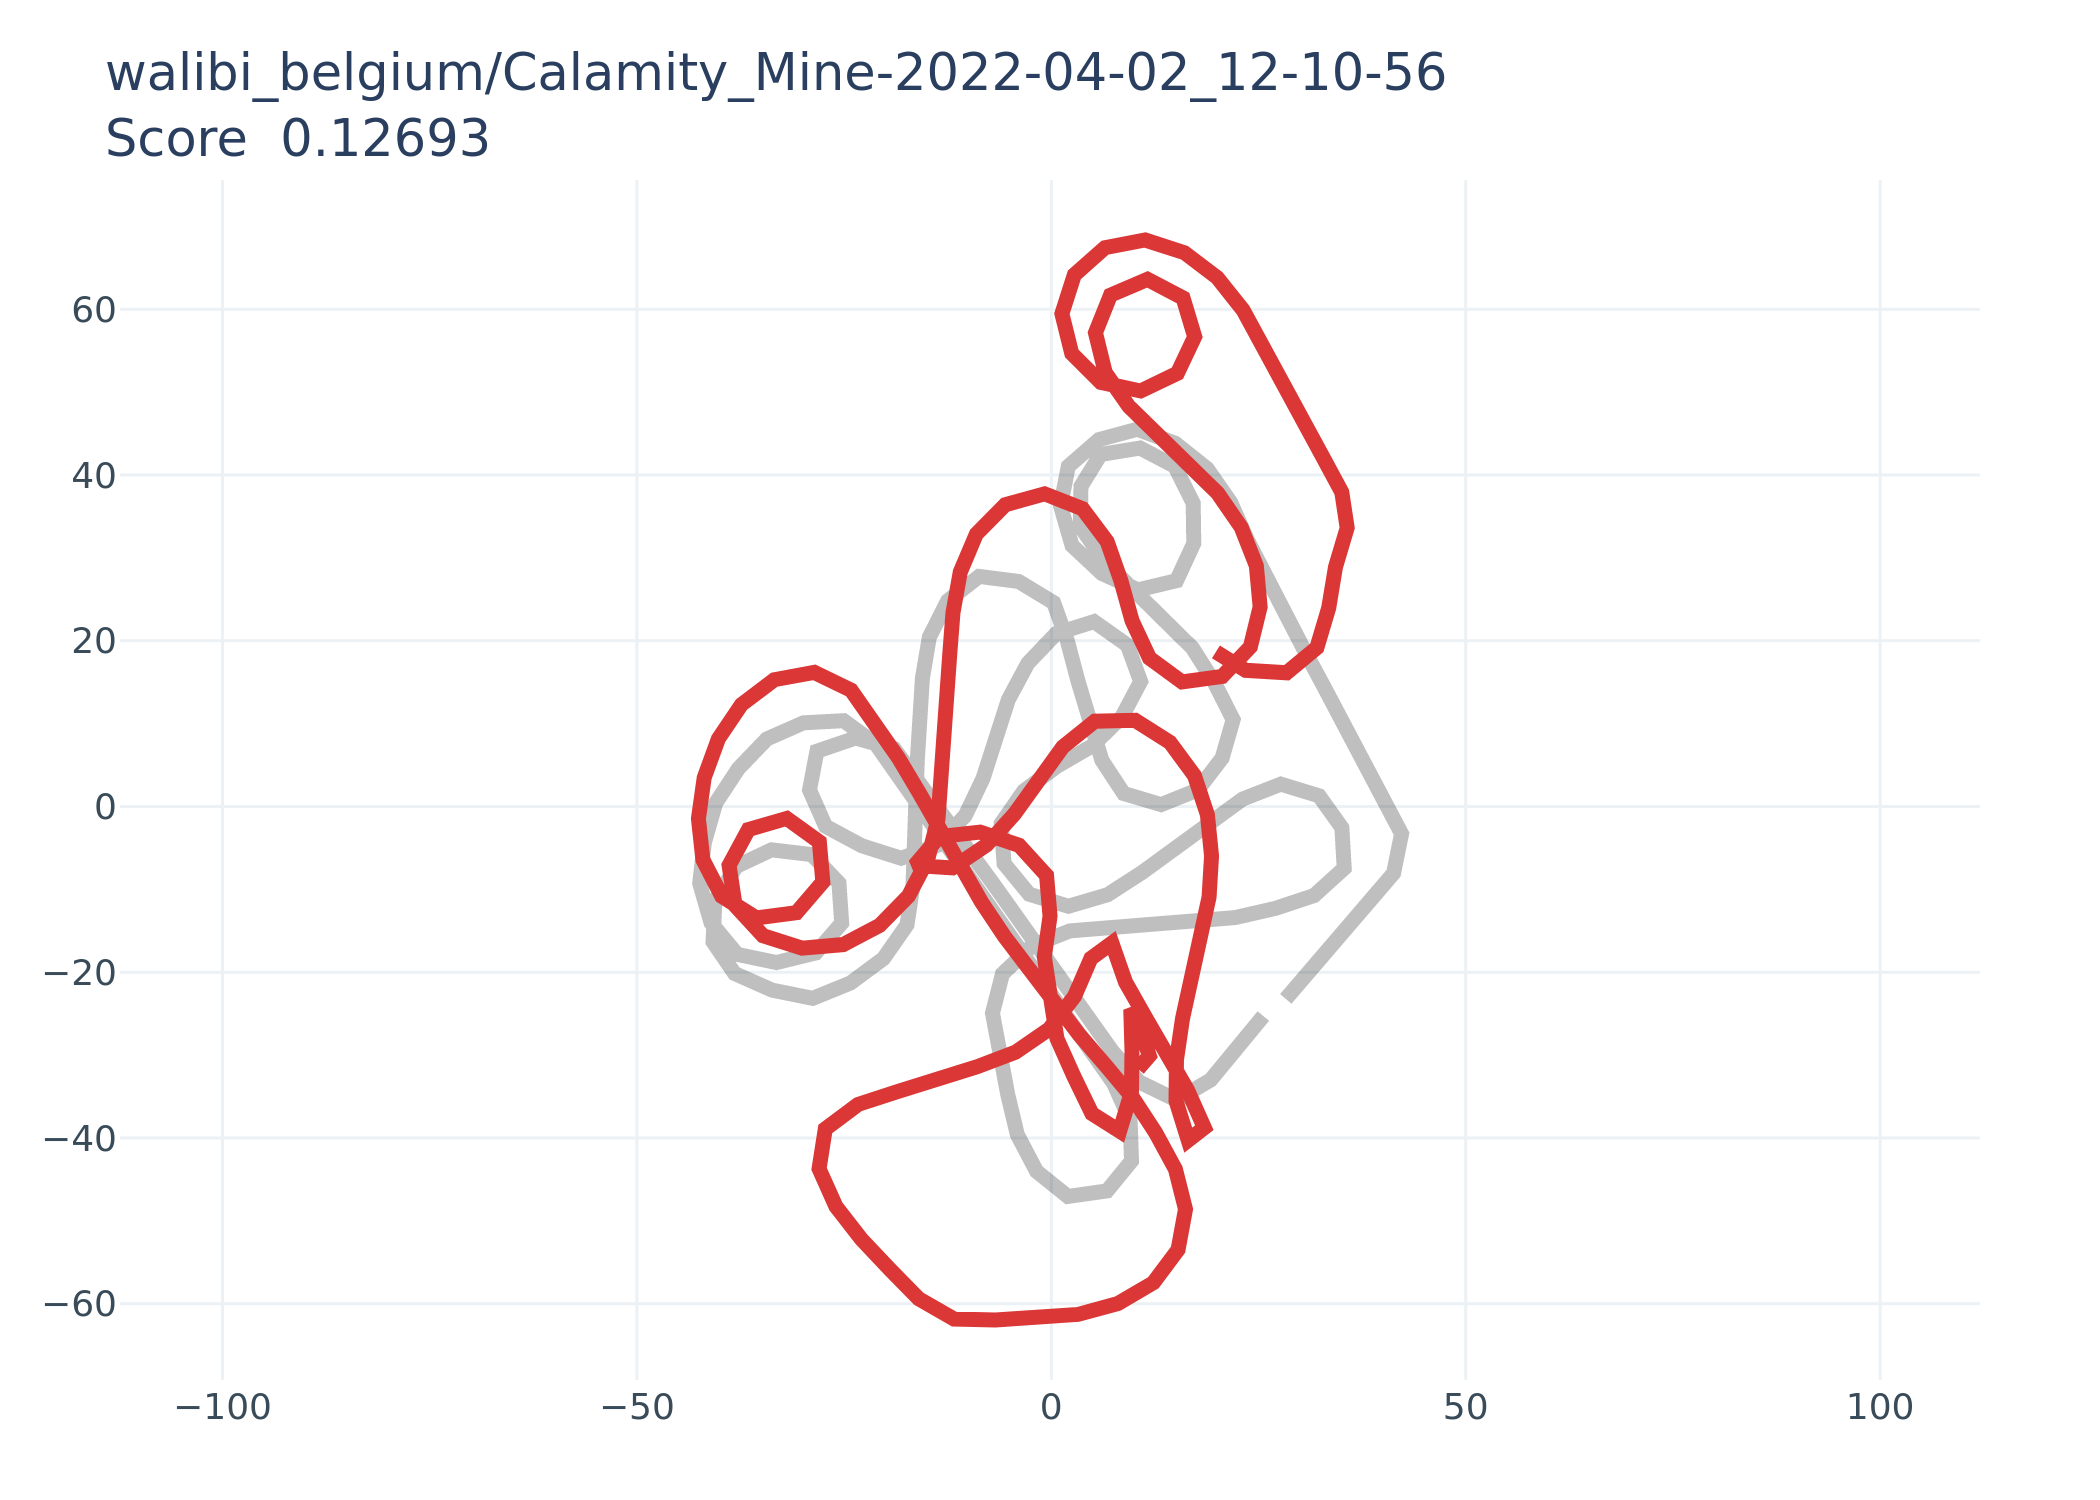
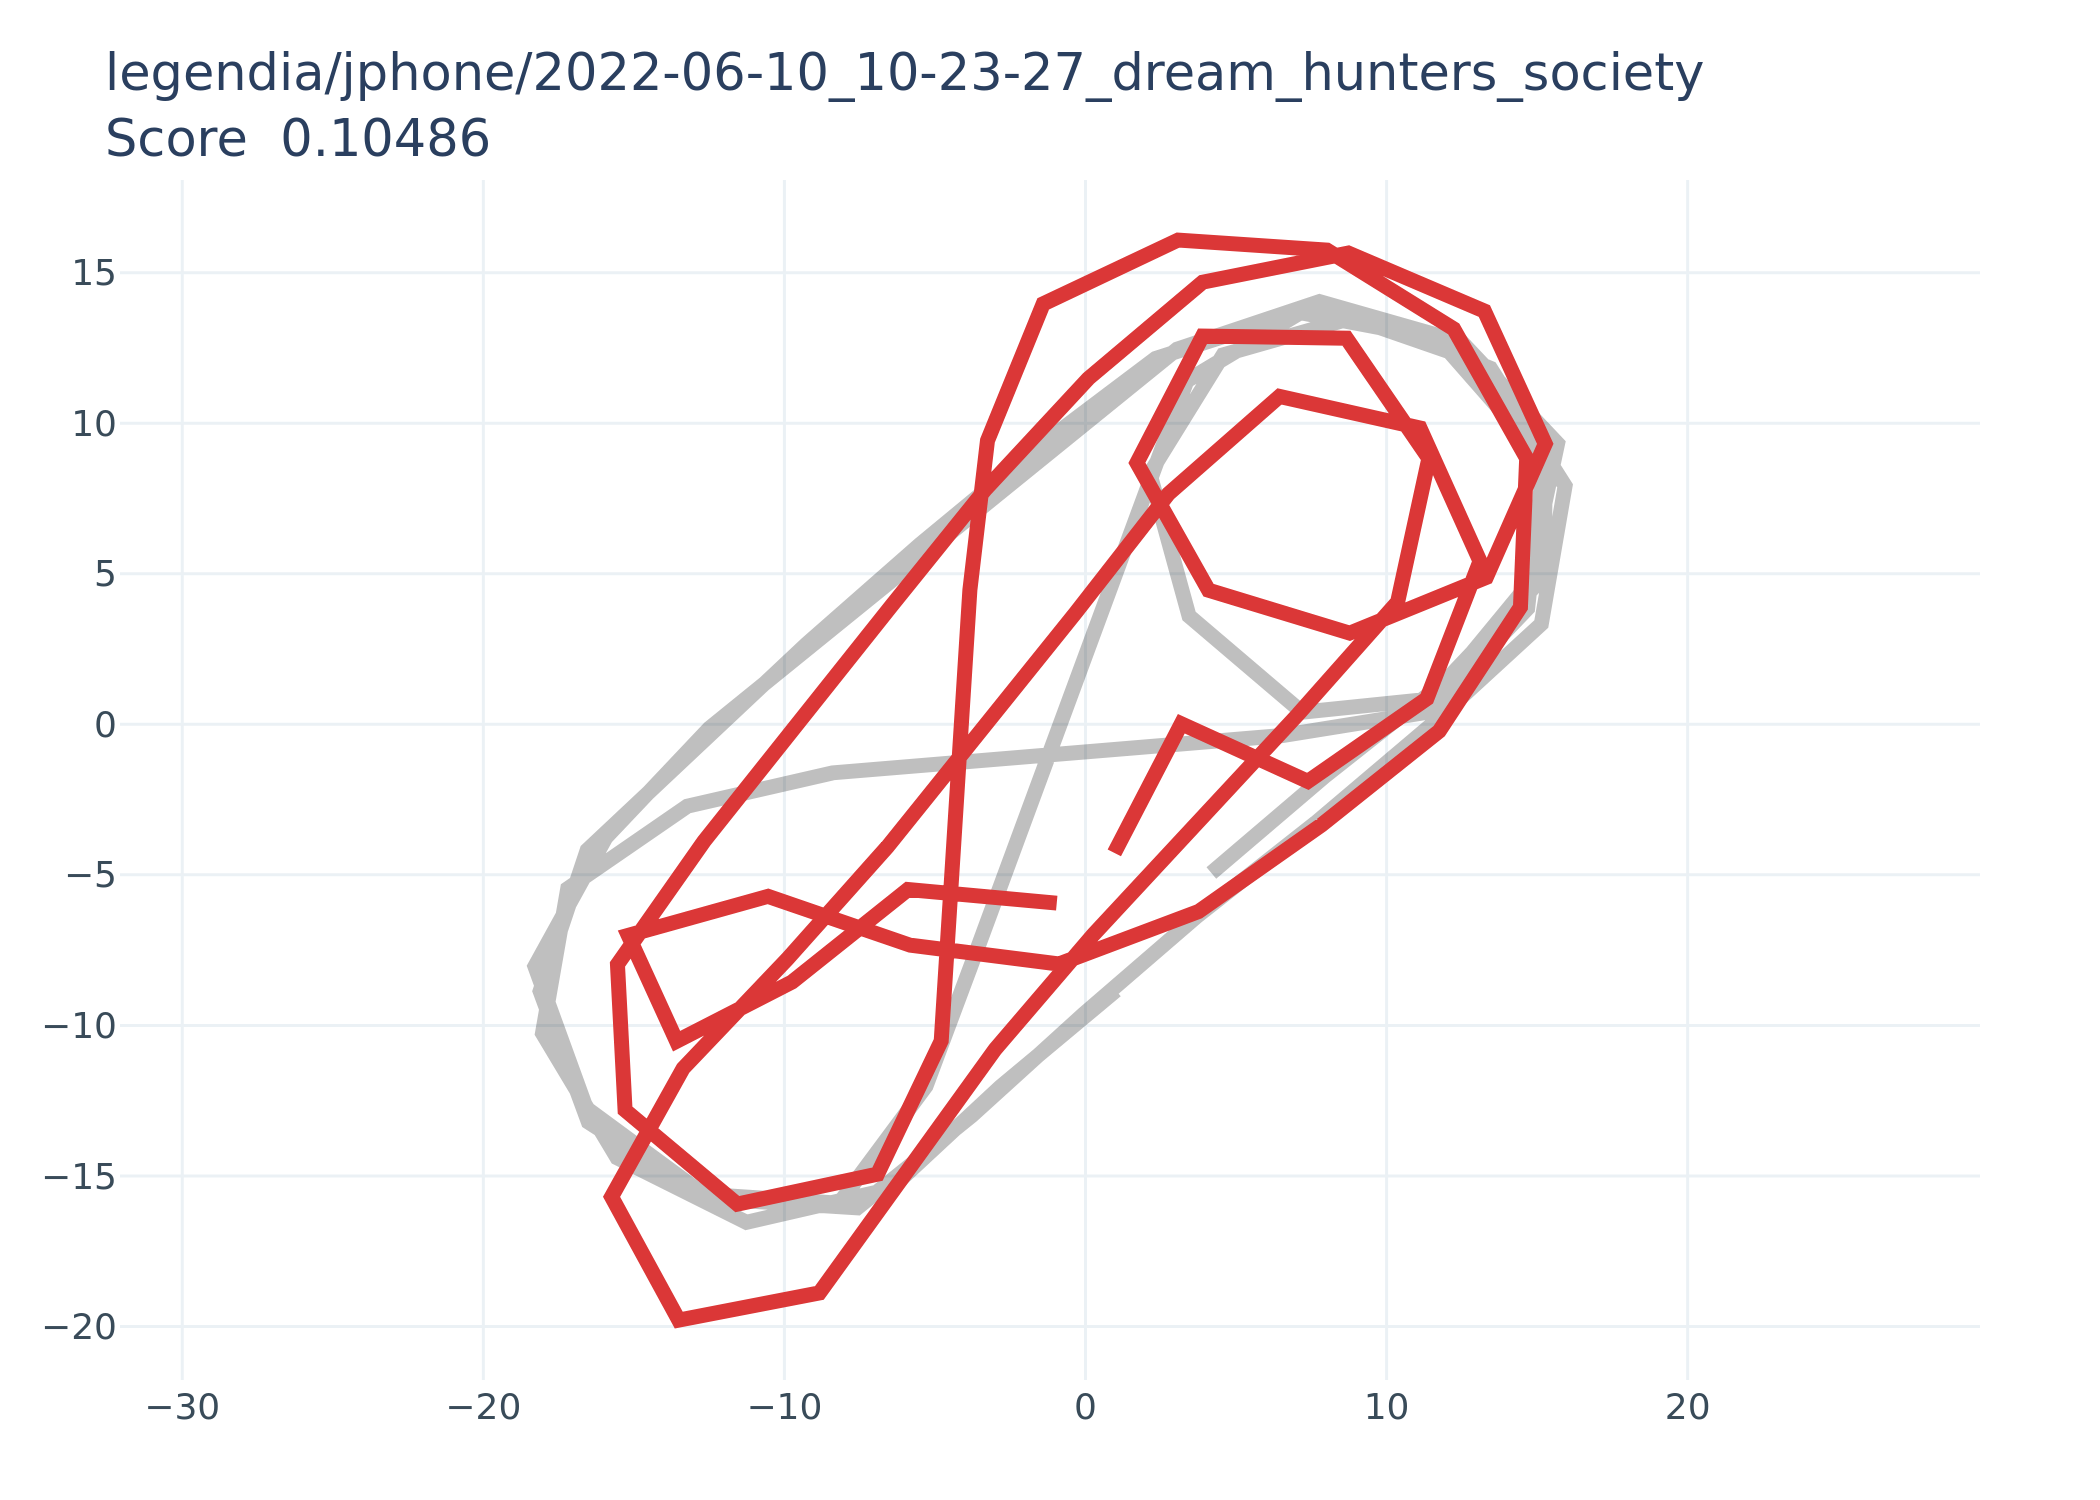
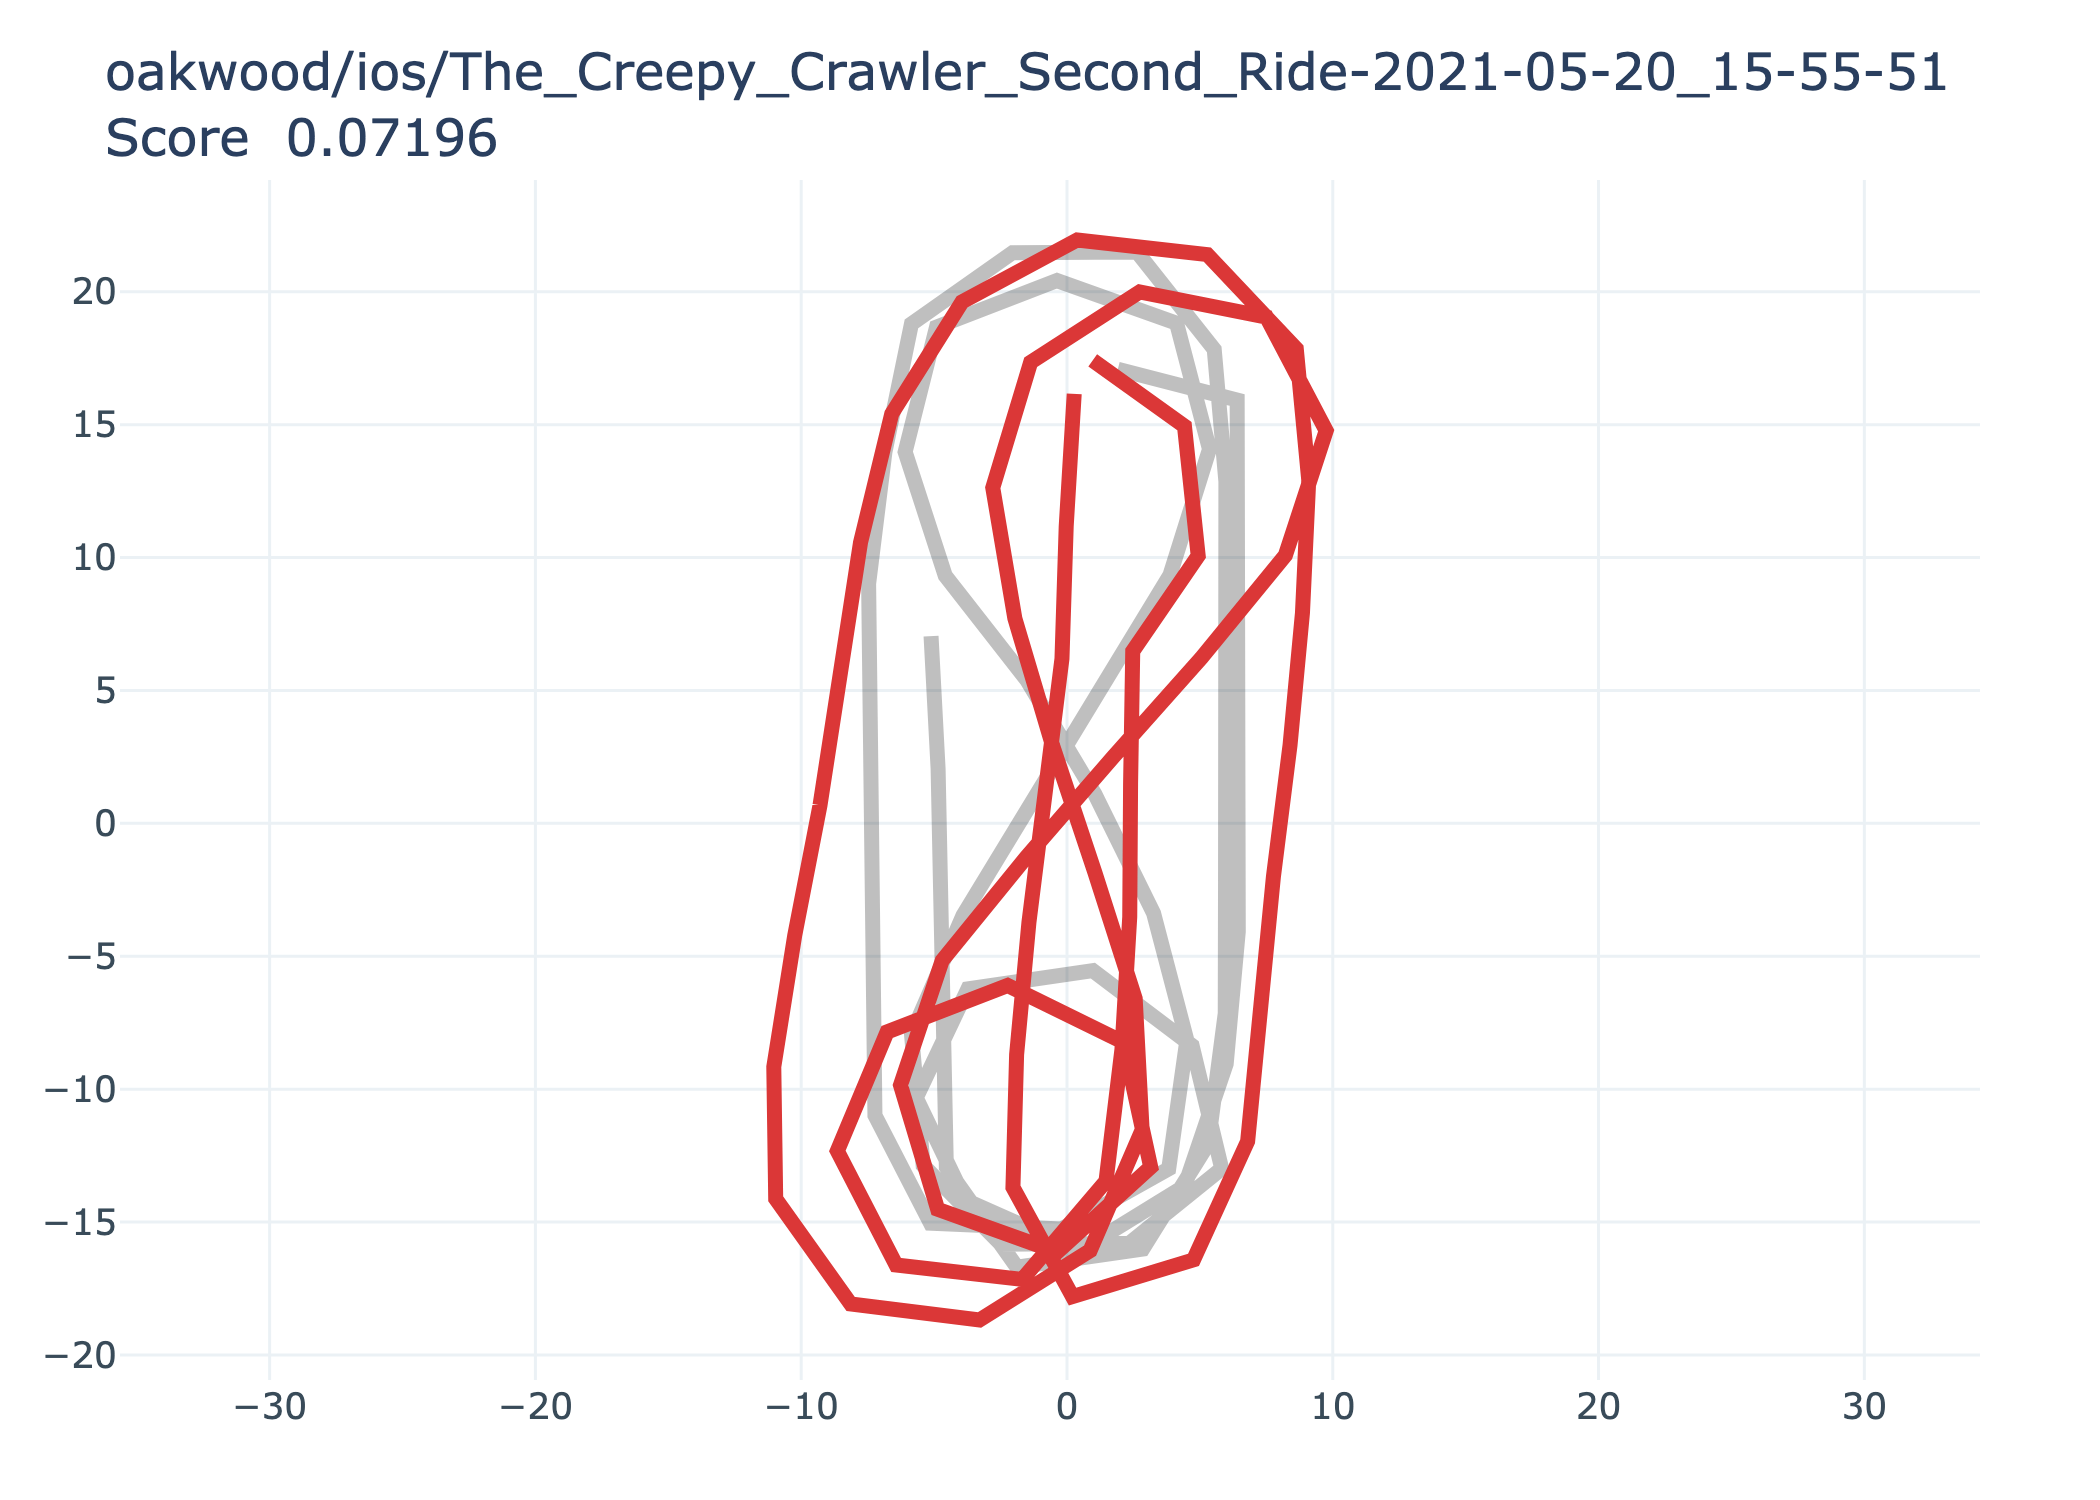
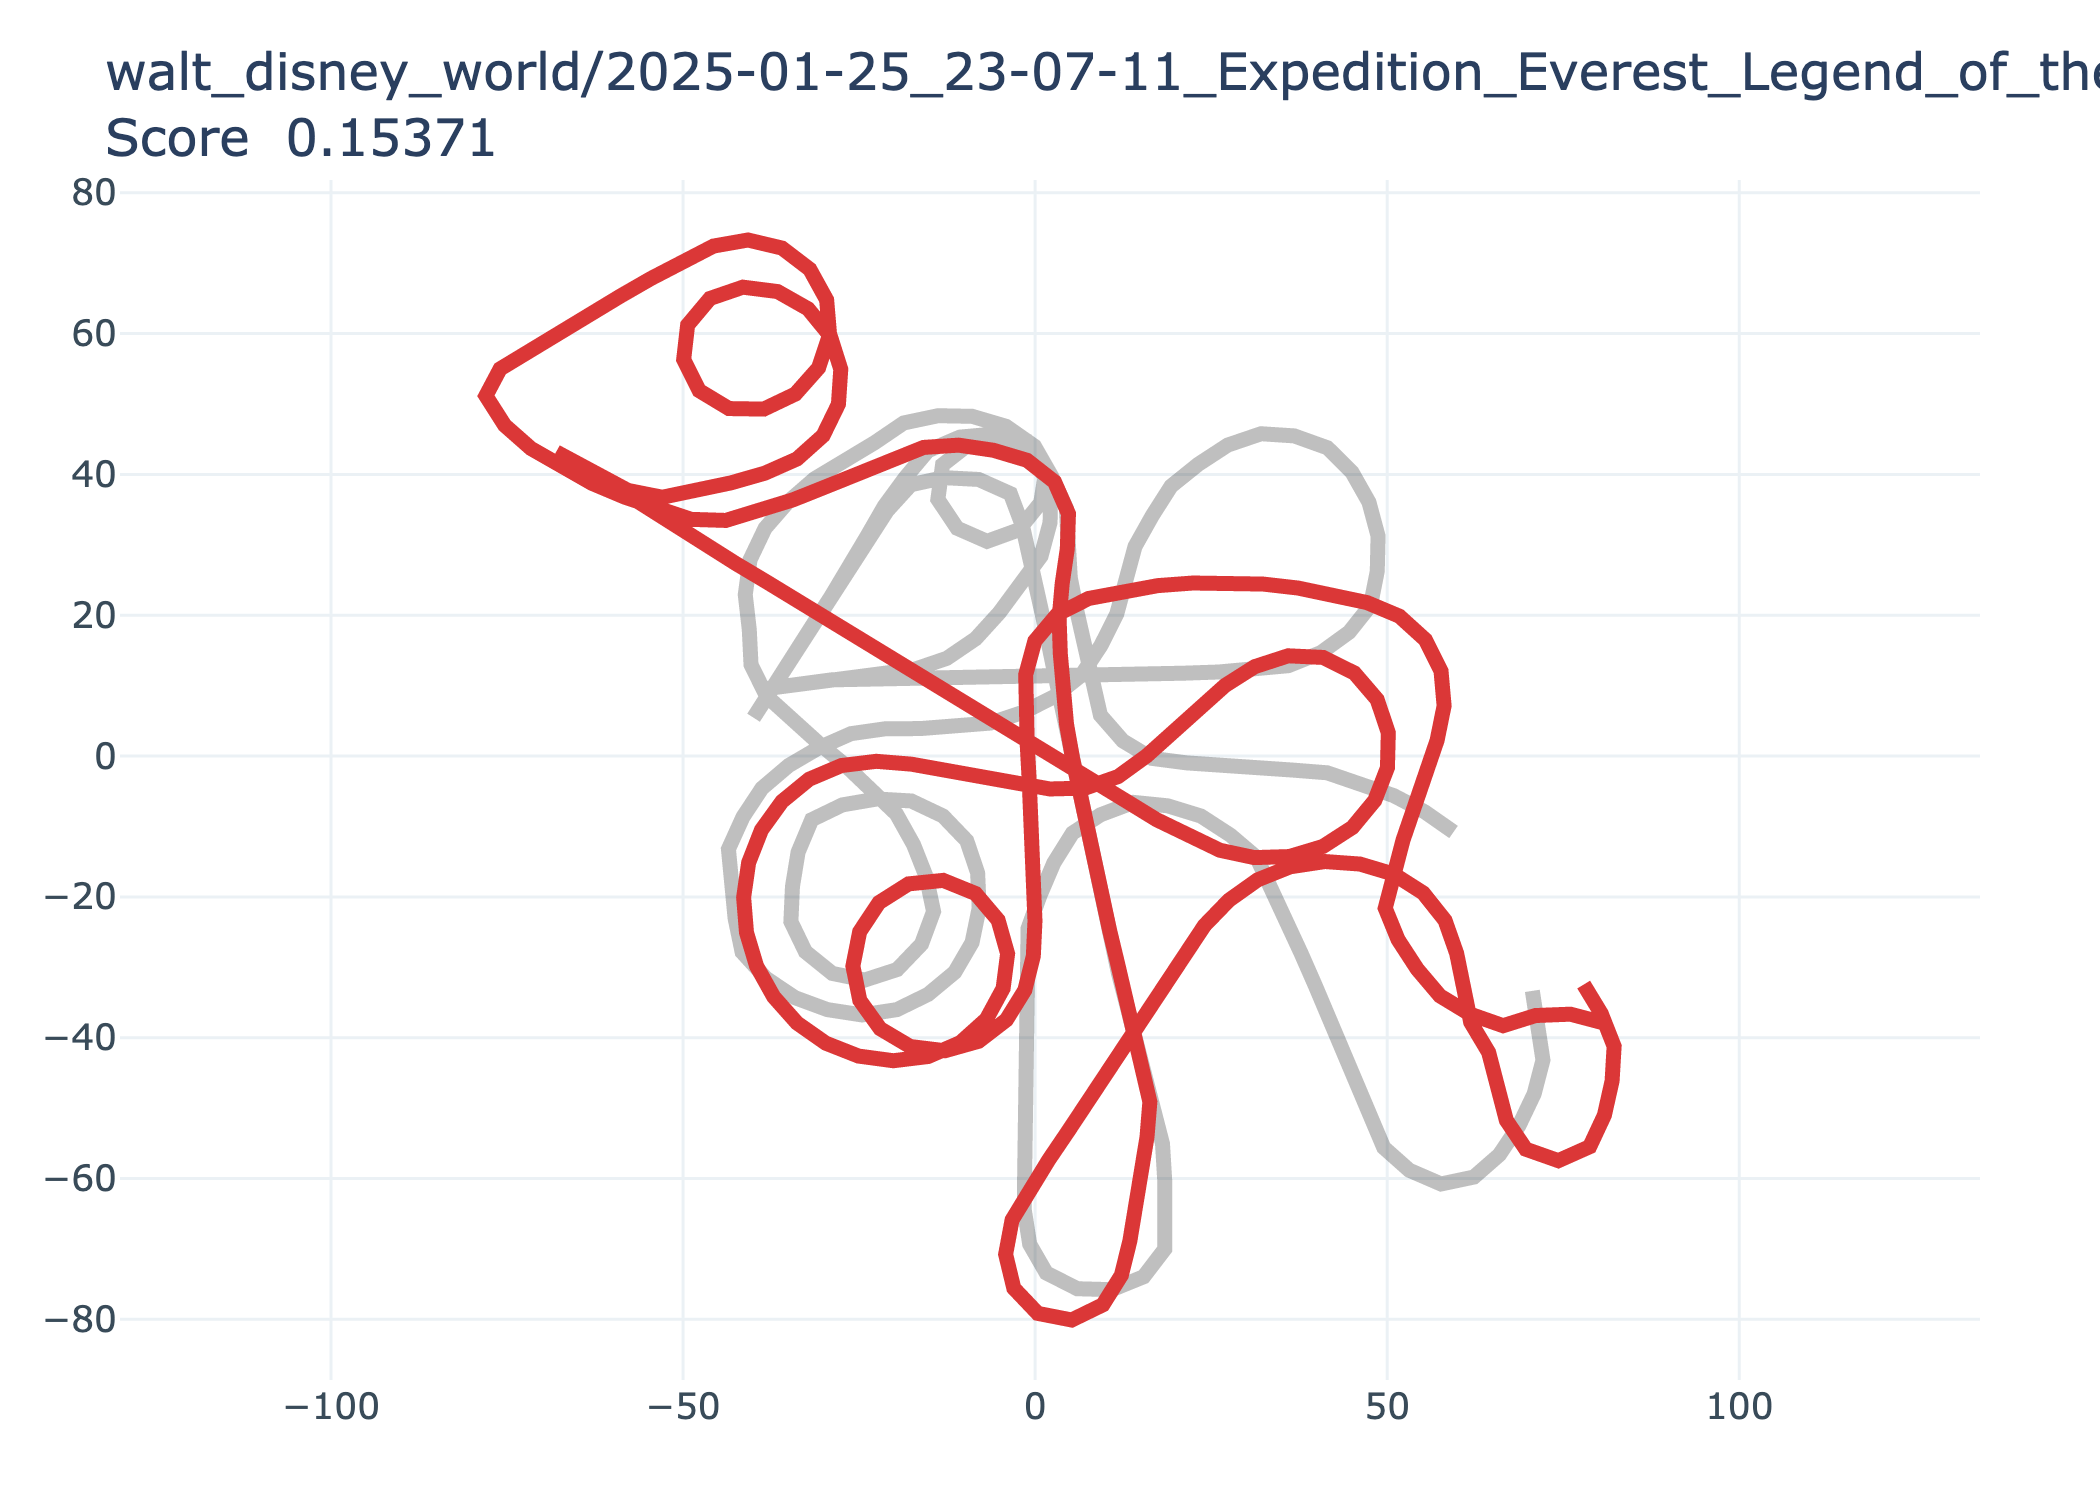
This is the distribution of the Horizontal Shape Matching Score.
The RMSE Horizontal Shape Matching Score is 0.108, with a minimum of 0.01727 and a maximum of 0.94667 across the validation dataset. This number is dimensionless, and can be interpreted as the expected pairwise feature of the horizontal coaster shape to be 10cm for every diagonal meter of the overall true footprint of coaster. In other words, an approximately 10% of deviation is expected.
The panels below show a selection of estimated horizontal roller coaster trajectory (red) overlaid against the traced ground truth (grey). The subtitle of each subplot shows the Horizontal Shape Matching Score for that particular output.


In terms of the inversion count, the RMSE is 0.57. The lifthill count and launch count RMSE are 0.34 and 0.58 respectively. These figures mean that Coaster Fusion can count the number of inversions, lifthills and launches to comfortably within an error of less than one.

Comparison for inversion, lifthill and launch count RMSE between estimated values and literature value. The first bracketed value is the RMSE, and N is the population. N varies across these plots because literature values may not be available for every ride in the validation dataset.
Discussions
Firstly, it is important to note that these results are somewhat worse than what can currently be expected when using Coaster Logger. This discrepancy arises because a portion of the dataset was collected using only the operating system Attitude and Heading Reference System (AHRS) algorithm. More recent recordings, in contrast, log raw uncalibrated data and employ a proprietary AHRS algorithm that has been specifically optimized for roller coaster applications.
The discrepancies between the algorithm output and values from the literature can be attributed to several factors.
In terms of shape validation, uncertainty in the traced geometry is inevitable due to perspective distortions in satellite imagery, especially for very tall coasters or those with overhanging structures. Dead reckoning errors accumulate over time due to sensor drift, which can affect both track length and shape accuracy, particularly in longer rides. Assumptions about the start and end of the ride also play a role, as minor delays in recording or early termination can lead to truncation errors, either inflating or underestimating the total track length. GPS inaccuracies further contribute to discrepancies, especially for indoor rides where signal reception is poor or completely absent. Additionally, the interpretation of roller coaster statistics varies across sources—literature values may rely on manufacturer specifications, which do not always align with real-world measurements or definitions used by the Coaster Fusion algorithm. Finally, the severity of these errors depends on whether one prioritizes absolute accuracy in numerical values or the overall qualitative representation of the coaster’s topology. While some discrepancies may seem large in terms of raw numbers, they do not necessarily impact the ability to recognize the general structure and experience of the ride.
For the RMSE of maximum acceleration and maximum speed, it is important to note that the literature often reports values provided by manufacturers, which may not accurately represent the actual acceleration and speed experienced during operation. These factors can vary significantly depending on conditions such as the time of day, the temperature and state of the roller coaster vehicles, weather conditions, and variations in weight distribution and seat location. For example, this video https://www.youtube.com/watch?v=A0629s5FWmY compares how Hyperia in Thorpe Park, United Kingdom, rides with different load distributions, and one can see significant differences in the speed profile, and presumably g-forces as well.
In the case of track length RMSE, discrepancies are expected, especially when the loading and unloading stations are in different locations, or in roller coasters with shuttle or swing launches, where the same segment of track may be traversed multiple times. Generally, the algorithm makes the key assumption that the starting and ending points of the roller coaster is at the same point in space, unless there is high quality GPS readings at both ends of the ride to provide good boundary conditions. Further, the initial and final speeds are assumed to be zero. A trimming pre-processor is designed to trim the recording so that these conditions are satisfy, but error can occur. As such, recordings where there are substantial gap between the start and the actual start of the recording, and/or the end and the actual end of the recording, may suffer from drifting.
For height RMSE, the differences may arise from variations in height definitions—whether the maximum height is measured from the ground level or from the lowest point of the track.
Regarding the inversion count, the Coaster Fusion algorithm defines an inversion based on a threshold of 135 degrees, which may differ from how certain ride manufacturers define inversions. This is particularly relevant for elements like over-banked turns or Immelmann loops, where the classification of the element as inverting or non-inverting can be ambiguous. Additionally, on flying coasters, where the rider's orientation changes throughout the ride, the definition of an inversion could vary, adding further complexity to the comparison.
Lifthill and launch counting errors can also stem from differences in definition, particularly for complex ride elements and layouts. Features like boomerangs, swing launches, and vertical lifthills blur the distinction between a traditional lifthill and a launch, making classification challenging. Additionally, the algorithm may struggle with launches that involve significant vertical elevation changes or undulating profiles, as these can introduce ambiguity in detecting acceleration patterns.
Final Note
I am still continuously improving the algorithm. If you have ideas or would like to contribute to the development or validation of Coaster Fusion, please feel free to reach out. I am also currently developing a purely machine learning driven AHRS system. If you want to help contribute training data or discuss ideas, do reach out and let me know!
Appendix
These are the tabulated statistics for the evaluation metrics, presented as:
iPhone only — all modern hardware (8f96f6cd-273d-4983-b075-a3905e2eb319)
Android only — This contains a mix of contemporary and old models (>5 years old) (fa9e7d97-9866-4b7c-a67a-3e6cc9c2c7f5)
iPhone only in GPS denied environments — No GPS measurements at all, such as indoor rides or challenging outdoor rides (1834cb50-49a9-4dc6-9193-8e6ea6087c7b)
Apple Watch only — This includes a lot of rides where phones are prohibited onboard, such as Steel Vegence, Top Thrill 2, Velocicoaster, Stardust Racers, F.L.Y., Eejanaika and Flying Dinosaurs, as such, it is also a biased dataset for high-intensity and high-g coasters, where the algroithm is expected to work less optimally (c1bfca5e-2234-4d2b-a1df-c6e7cd257947)
Note: The UUID is just for internal reference.
Table 1: iPhone Only
| Metric | Mean | Median | Stdev | Min | Max |
|---|---|---|---|---|---|
| Score | 0.10841 | 0.09856 | 0.05928 | 0.01727 | 0.94667 |
| Height Rmse | 4.54664 | 2.07471 | 3.32762 | 0.00286 | 32.58789 |
| Speed Rmse | 2.61250 | 1.46952 | 1.77000 | 0.00005 | 16.23351 |
| Length Rmse | 135.42544 | 59.47462 | 102.49208 | 0.01324 | 2135.05664 |
| G Force Rmse | 0.89572 | 0.68294 | 0.47185 | 0.00705 | 2.47886 |
| Inversion Rmse | 0.57947 | 0.00000 | 0.54862 | 0.00000 | 6.00000 |
| Launches Rmse | 0.58105 | 0.00000 | 0.53993 | 0.00000 | 4.00000 |
| Lifthills Rmse | 0.34185 | 0.00000 | 0.32633 | 0.00000 | 2.00000 |
Table 2: Android Only
| Metric | Mean | Median | Stdev | Min | Max |
|---|---|---|---|---|---|
| Score | 0.17462 | 0.10882 | 0.47778 | 0.02012 | 4.95598 |
| Height Rmse | 6.30511 | 2.67564 | 5.02040 | 0.00396 | 61.73736 |
| Speed Rmse | 3.86203 | 1.59734 | 3.08518 | 0.00018 | 35.18266 |
| Length Rmse | 212.04516 | 64.97968 | 177.49257 | 0.19380 | 1530.25362 |
| G Force Rmse | 0.83353 | 0.76662 | 0.37440 | 0.05199 | 1.71342 |
| Inversion Rmse | 0.94969 | 0.00000 | 0.90727 | 0.00000 | 10.00000 |
| Launches Rmse | 0.64470 | 0.00000 | 0.58659 | 0.00000 | 3.00000 |
| Lifthills Rmse | 0.35421 | 0.00000 | 0.33394 | 0.00000 | 2.00000 |
Table 3: iPhone in GPS Denied Environments
| Metric | Mean | Median | Stdev | Min | Max |
|---|---|---|---|---|---|
| Score | 0.14680 | 0.13218 | 0.07139 | 0.02965 | 0.42727 |
| Height Rmse | 4.75632 | 1.80159 | 3.60774 | 0.05316 | 20.31206 |
| Speed Rmse | 3.79133 | 1.76718 | 2.95498 | 0.00475 | 14.32311 |
| Length Rmse | 171.10494 | 96.34871 | 117.91532 | 0.29353 | 612.02678 |
| G Force Rmse | 0.73889 | 0.48805 | 0.45817 | 0.01011 | 2.35939 |
| Inversion Rmse | 0.72232 | 0.00000 | 0.67356 | 0.00000 | 4.00000 |
| Launches Rmse | 0.51075 | 0.00000 | 0.48023 | 0.00000 | 2.00000 |
| Lifthills Rmse | 0.45175 | 0.00000 | 0.42122 | 0.00000 | 2.00000 |
Table 4: Apple Watch Only
| Metric | Mean | Median | Stdev | Min | Max |
|---|---|---|---|---|---|
| Score | 0.22886 | 0.14271 | 0.59578 | 0.06005 | 4.17317 |
| Height Rmse | 5.05843 | 3.68830 | 2.81345 | 0.33104 | 12.77396 |
| Speed Rmse | 4.49570 | 1.62298 | 3.54847 | 0.01228 | 16.49491 |
| Length Rmse | 164.35592 | 56.25399 | 122.09424 | 1.41387 | 624.98672 |
| G Force Rmse | 0.92845 | 0.55582 | 0.56421 | 0.02770 | 1.98867 |
| Inversion Rmse | 1.03775 | 0.00000 | 0.95321 | 0.00000 | 5.00000 |
| Launches Rmse | 0.93678 | 0.00000 | 0.83299 | 0.00000 | 3.00000 |
| Lifthills Rmse | 0.35675 | 0.00000 | 0.33328 | 0.00000 | 1.00000 |
Last Updated: October 2025